


Summary
- The peak for interest rates looks to be in (or nearly in) at 5.25% in the UK and 5.5% in the US. This is close to the peaks we saw the rate cycle in the mid-2000s.
- Equities look to be fairly priced given this new environment. US equities trade at higher valuations but this reflects the fact that the US prowess in software and Artificial Intelligence should mean they continue to capture more of the growth on offer.
- If you want unloved bargain basement prices, then look no further than the UK’s FTSE 100 index which trades at below 10 times earnings. This sort of valuation is consistent with double digit returns for investors even if the UK stays at today’s depressed valuations.

- Returns on government bonds have risen to make them competitive with today’s cash rates. As an example, a 30 year index linked gilt will pay you RPI inflation plus 1.6% guaranteed today. This interest rates was RPI minus 2.5% less than two years ago. Bond markets continue to be volatile but there is now real value on offer.
- Prices for commercial property and alternative assets such as solar and wind farms have fallen fast to reflect today’s higher interest rates. UK IPD commercial property valuations are almost 25% below their peak and investment trusts can be bought at healthy discounts to these lower valuations. We continue to like the longer term returns we see on offer from these assets.
2023 First Half Overview
You are often in two sorts of worlds as an investor. One is where you have lost some money but there are now plenty of good-looking opportunities on offer. The other is where you have made some money but new opportunities are thinner on the ground. It goes without saying that the first world is much less fun to be in at the time but is also the one where, if you can keep your discipline, the patient (and sometimes brave) investor is ultimately rewarded. We very much feel that is the world we are in today. The challenge for us is to be prepared to buy (or not sell) investments that have lost (and often are still losing) money. This can be harder than you might think. As Warren Buffet has said, you need to be greedy when others are fearful. There is plenty of fear around, especially in bond markets and interest rate sensitive assets like property. Where are the opportunities?
Equities
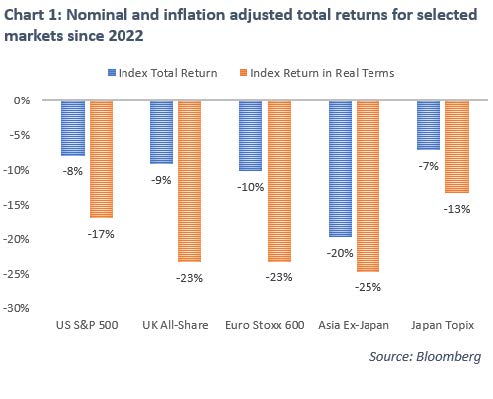
We thought we would start by reviewing equity markets since central banks started raising rates to combat inflation at the start of 2022. Chart 1 shows selected equity market total returns in nominal and inflation adjusted terms in US dollars. Most developed market returns are pretty similar: down -7% to -10% in nominal terms. This rises to around -20% after allowing for inflation. The exception here is Asia ex-Japan which has been hit by China’s ongoing real estate crisis. Nominal returns are -20% but inflation has run at lower levels in Asia so inflation adjusted the fall is -25%.
Where does this leave valuations? They look reasonable to us after these falls but are not yet cheap. One reason for this is that at the end of 2021 equity valuations got pretty stretched – particularly for the post Covid winners – so have fallen from relatively high heights. The second reason is that there are, of course, better alternatives out there now. Cash rates are back above 5% and index linked bonds can earn you inflation plus 1% or more guaranteed. This second point – how attractive are equities compared to the alternatives – is shown in Chart 2. This shows what is known in the jargon as the equity risk premium, or how much equities return over risk free government bonds (which now of course offer much higher returns).
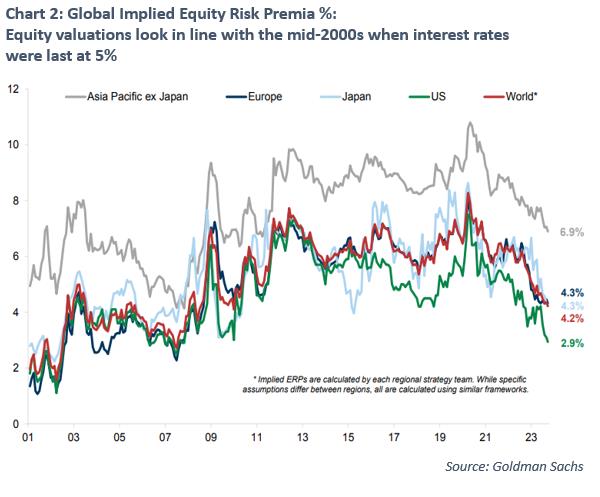
A couple of things stand out to me. The first is that on a global basis (the red line) we are back to being in line with valuations we saw in the mid-2000s. This makes sense to me as this is the last time we saw rates above 5% in the US and UK. So today’s valuations look more or less consistent with today’s interest rate environment. The second is the continuing valuation gap between the US and the rest of the world. The market clearly expects the majority of growth to come from the US and in particular from the large cap technology focussed companies. The story of the last decade has been Amazon taking all the growth from traditional retailers, Google taking the growth from the rest of the advertising industry and Apple taking plenty of the growth in discretionary spend. This has come at the expense of non-US companies (the recent struggles of John Lewis are an obvious example).
The equity market clearly thinks these trends will continue and US companies will continue to take more than their normal share of global growth. This means US companies trade on average at a premium to the rest of the world. I would be reluctant to bet against this trend ending in the short term. The US remains at the centre of the advance in technology and artificial intelligence (AI) and I would expect many of the financial gains from AI to end up, one way or another, with US companies.
This leaves other regions trading remarkably cheaply. Much of Asia ex-Japan is at or near valuation lows (and remember this region generally benefits from faster economic growth than much of the rest of the world). And of course, the poor old UK is exceptionally cheap today. The UK’s FTSE 100 earnings yield is over 10% today (compared to 5% in the US for example). So, if the UK can just keep today’s profit levels up, double digit returns look possible even if it continues to remain out of favour and does not re-rate higher. If it does fall back in favour (as Japan has done this year) then there is upside from there.
Our approach to all this is to run a so-called barbell approach with (for our sterling based clients) about half your equity allocation in the faster growing US and about half in the rest of the world, with the majority of this in the UK and (to a lesser extent) Asia. Looking backward, the right call was to have had all your money in the US. But looking forward we think having feet in both camps makes for a better portfolio.
Bond markets
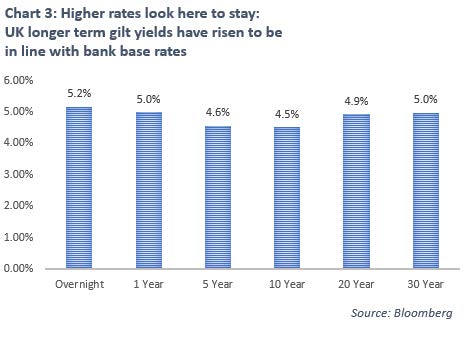
You will of course know that interest rates have risen from effectively zero to 5.25% in the UK and 5.5% in the US. It looks like this will be the peak (or close to the peak) for interest rates this cycle. The real change this year (and particularly this quarter) is that investors used to think that these bank base rates would need to be cut again pretty quickly as the economy slowed in 2023. Now, with the economy remaining strong, investors are no longer expecting interest rate cuts. Interest rates of 4% or more are priced in as the new long term normal. This has pushed longer term fixed rates up as you can see in Chart 3.
Part of this is of course good news. Inflation falling without unemployment rising is the soft landing that looked unlikely at the start of the year. Part of it is more worrying. The Bank of England, having bought government bonds for much of the last decade to help lower rates, is now selling around £8bn of government bonds a month. Developed market governments are also running large deficits (5% of GDP currently in the UK, 6% in the US). These deficits are funded by issuing more government debt. These two forces are pushing yields higher. So far this sell-off has been pretty well-behaved (and created the attractive looking yields you can see above) but as long as the direction of travel is higher this puts pressure on all other asset prices. Ultimately higher rates should force governments to reduce their deficits (and perhaps pressure central banks to slow their bond sales). This should ultimately keep a lid on the rate rises. But this – rather than inflation – is the main risk for bond markets today.
This of course creates opportunities, one is to lock into inflation beating returns by buying inflation linked bonds in the US and UK. We also continue to like the yields available on shorter dated corporate debt. This takes less of the risk of longer term interest rates and, for not much extra credit risk, still offers returns of over 6%.
Property and alternative assets
Higher interest rates have pushed down the prices of many alternative cashflow producing assets. Note the earnings power of these assets has not been affected – in fact many have done well from higher energy prices and higher inflation in general. It is just the price you pay for these cashflows has gone down to reflect the reality of higher interest rates. Where this is most obvious is residential property. Rents are strong and rising but mortgage rates have risen by more and a 4% yield (say) is just not going to cut it when you look at today’s juicier alternatives.
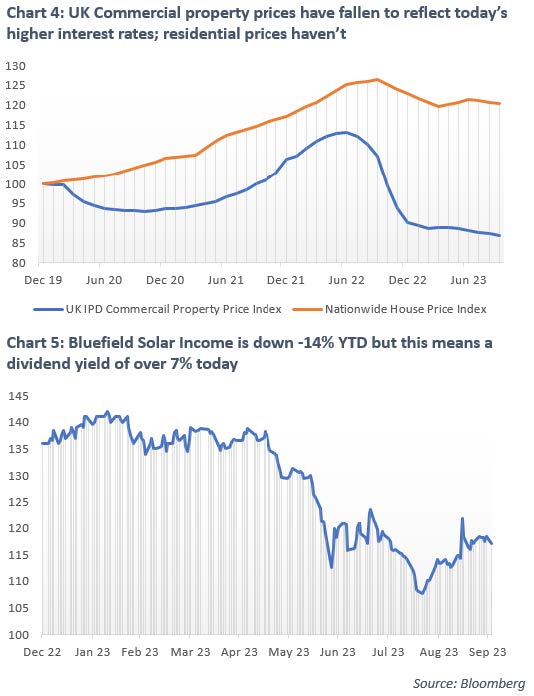
Commercial property is probably less exposed to rising borrowing costs these days but it still needs the yields it offers to be attractive to the alternatives on offer today. UK commercial property prices fell about 20% in the second half of 2022 and have we think, more or less adjusted to the reality of today’s higher rates (see Chart 4). Residential property (whose prices are almost 30% ahead of commercial property since the start of 2020) probably has more adjusting to do.
We have had a similar effect in the alternative assets we invest in. As an example, Bluefield Solar income is probably the safest of the solar and wind farms we cover. Around half its income comes from inflation linked government subsidies, the rest is linked to energy prices (but is mostly hedged in the short run). The underlying portfolio has done well: benefitting from higher inflation and higher energy prices. The price has, however, fallen -14% year to date. Higher cashflows and lower prices mean our expected return from this investment has risen.
Today’s losses will, we think, translate into tomorrow’s higher returns. Our alternative assets have been a drag on this year’s returns but longer term returns look attractive from today’s starting point. We intend to keep these assets to make sure we realise these returns.
12 month outlook
The good news is that equities, bonds and alternatives all look well placed to claw back the losses of the last 18 months and, over the longer term, generate returns that beat inflation and (a much harder task these days) cash deposit rates. However, as is often the case, the path over the next 12 months is much less clear.
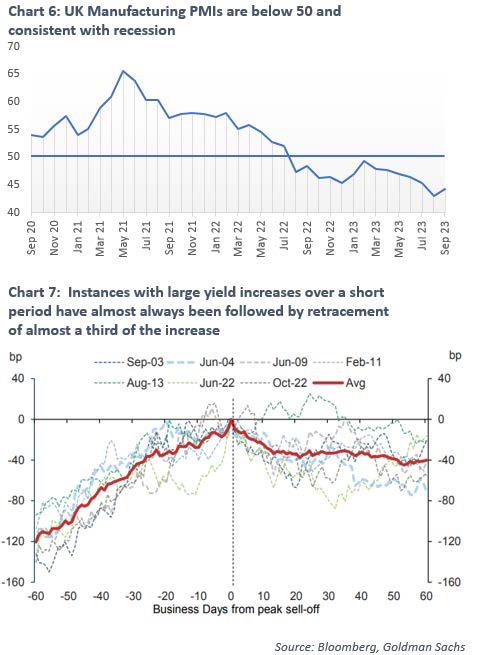
Our base case is that the slowdown that so many have been expecting will eventually start to appear in the next few months. In the UK, forward looking manufacturing surveys continue to be gloomy (see Chart 6 where a survey number below 50 shows more respondents see things getting worse rather than better and so is consistent with a manufacturing recession). In the US, the credit card spending data we track has similarly started to point down. In addition, student loan repayments, which were suspended in the aftermath of Covid, are due to begin again in October. A slowdown in consumer spending should take the pressure of the longer term fixed rates (a 5% guaranteed return looks pretty attractive if a recession is round the corner).
A slowdown should help put a floor on bond prices and mean our alternative assets start to generate their expected returns going forward. What would a slowdown mean for equities though? US equities – where valuations and growth expectations are the highest – look the most vulnerable to disappointment to us. UK equities, which already trade at historic lows and are pretty much universally unloved, should have less far to fall. Either way, our bond and alternative assets are positioned to provide a cushion.
One (upside) scenario is that the global economy continues to be strong. In this case we feel we have enough risk exposure (mainly through equities) to capture the returns on offer. The main risk to our base case is that longer term rates (which are not directly under central bank control) continue spiking higher. Historically, large spikes in yields such as the ones we see today have been followed by retrenchments of around a third of the increase (see Chart 7). This means we are inclined to keep our (more bearish) bond overweight positioning on for now. If strong growth continues we might change our view but for now the losses we have seen in fixed income and alternative assets mean they look like the right hunting ground for opportunities to us.
Chris Brown
Chief Investment Officer
The value of investments may fall as well as rise and you may not get back all capital invested. Past Performance is not a guide to future performance and should not be relied upon. Nothing in this market commentary should be read as or constitutes investment advice.